SportPilot.
Hosting Rodeo Sport Events, All in One Place.
Company
SportPilot x LaunchForce (Agency)
May - June 2023
Team
Founding Product Designer (Me)
2 Full Stack Developers
Clients
Status
In Development
*Disclaimer
Due to an NDA, I'm unable to showcase a larger breadth of my work and sensitive client info is fictionalized.
How did I add value?
100% clients sign-offs
A user-centered MVP design balancing among user needs, client requirements, and technical constraints.
Improved operational efficiency
Suggested success metrics: task completion rates & user satisfaction scores

A&J
Co-founders of SportPilot
"Your design is super user-friendly. You are knocking it out of the park! We like the way you worked and communicated with us, and you always helped bring our vision to life."

Ramon Rodriguez
Sales and Operations at LaunchForce
"Yanling played a pivotal role in our business's growth through her exceptional skills as both a product strategist and business thinker. She has a keen mind for solving problems from an end-user's point of view, and cultivates these solutions with exquisite UX/UI design. "
Project Overview
Background.
A vast underserved market, yet scattered existing workaround tools in a traditional industry.
Huge Business Opportunity. Underdeveloped Market.
In the U.S., there are 7,500+ registered riders and 650+ rodeo events annually, totaling over $30M in prize money.
Complex Domain Challenge. Outdated Software.
As a traditional industry, rodeo sport has many rules and norms that are not explicitly written in public.
Problem Space.
To organize events, rodeo producers were stuck juggling manual workarounds, costing them time and money.
Existing Workaround Solutions
There were workarounds.
However, this patchwork led to data entry errors and messy communications with riders, creating friction on both sides of the marketplace.
Final Design.
A unified end-to-end rodeo event hosting and racing experience for producers and riders (B2C) from 0→1.

Unified Event Management
Real-time edits, entry tracking, and payout coordination—designed to support fast operations during live events.

Birdview Dashboard
A high-level snapshot of key areas, using modular sections and data visualization

Streamlined Event Setup Flow
Guided flows, and fewer errors

Clear Event Schedule View
Jump straight into ongoing events — no more digging through spreadsheets or messages.
Project Constraints
What I Walked Into.
Design core workflows while establishing a product design process from scratch.
This project began with two experienced rodeo producers/riders, our clients, who were subject matter experts but didn't know how to build it.
Limited direct access to users
No existing product or design process
Engineering team new to shipping software products
As a result, in my 2 months of project timeline, as the founding product designer, I owned problem framing, workflow definition, and UX execution. In the absence of a product process, I also guided stakeholders and engineers through alignment, prioritization, and decision-making.
Design Process
Who are the people involved?
Customers, Users, and Their Needs.

Producers
(Primary Customers/Users)
"I need an efficient way to set up my events and handle everything from entries to final results in one place."

Riders
(Secondary Customers/Users)
"I just want to quickly find the schedule, check my race class, and see what the payouts are."
Viewers
(Tertiary Users)
"I want to see live results as they happen and feel like I'm actively participating in the event."
How might we uniquely position SportPilot for a competitive advantage?
Competitive Analysis.
Most offerings were feature-driven rather than workflow-driven.
User interactions were organized as long, standalone forms and disconnected features, with limited continuity across the overall user journey.


This insight informed my decision to design SportPilot around a continuous, task-based workflow.
How did I establish shared clarity with clients and developers?
Research & Synthesis.
I synthesized fragmented stakeholder input, early wireframes drawn by clients, and developer context into a single end-to-end workflow that became the team's source of truth.

Rodeo Race Workflow diagram for 3 user Personas
What could be improved with the current workflow?
Painpoints.
After analyzing competitive products, I identified three unaddressed key pain points occurring repeatedly that were crucial for the producers' workflows. I aimed to target these to turn them the competitive advantages of SportPilot.

HMW increase producer adoption and operational reliability by simplifying event drafting and on-site management?
Problem Reframing.
In order to build an MVP version of a holistic rodeo event system, with the limited dev resources and time, I narrowed down my design focus to these two key areas.
Design Goal 1:
On-site event management with fast edits, smooth operations
Target for the speed and control.
Design Goal 2:
Guided event creation workflow to reduce overwhelms
Handle complex rules and configuration setup.
Design Goal 1: On-site Event Management
At first, I designed a structure to reduce the time spent navigating between disconnected files.
Before.

Iteration 1: Events Page

Iteration 1: Events Page - Entries/Draws Table View
After.

🤨 Problem:
Users reported confusion and friction when navigating back and forth across categories for different events.
🔨 Solution:
Moved menu from left to top for more horizontal space and easier content scanning.
Flattened the information structure to simplify visual hierarchy.
Reduced interaction cost by streamlining cross-category navigation.
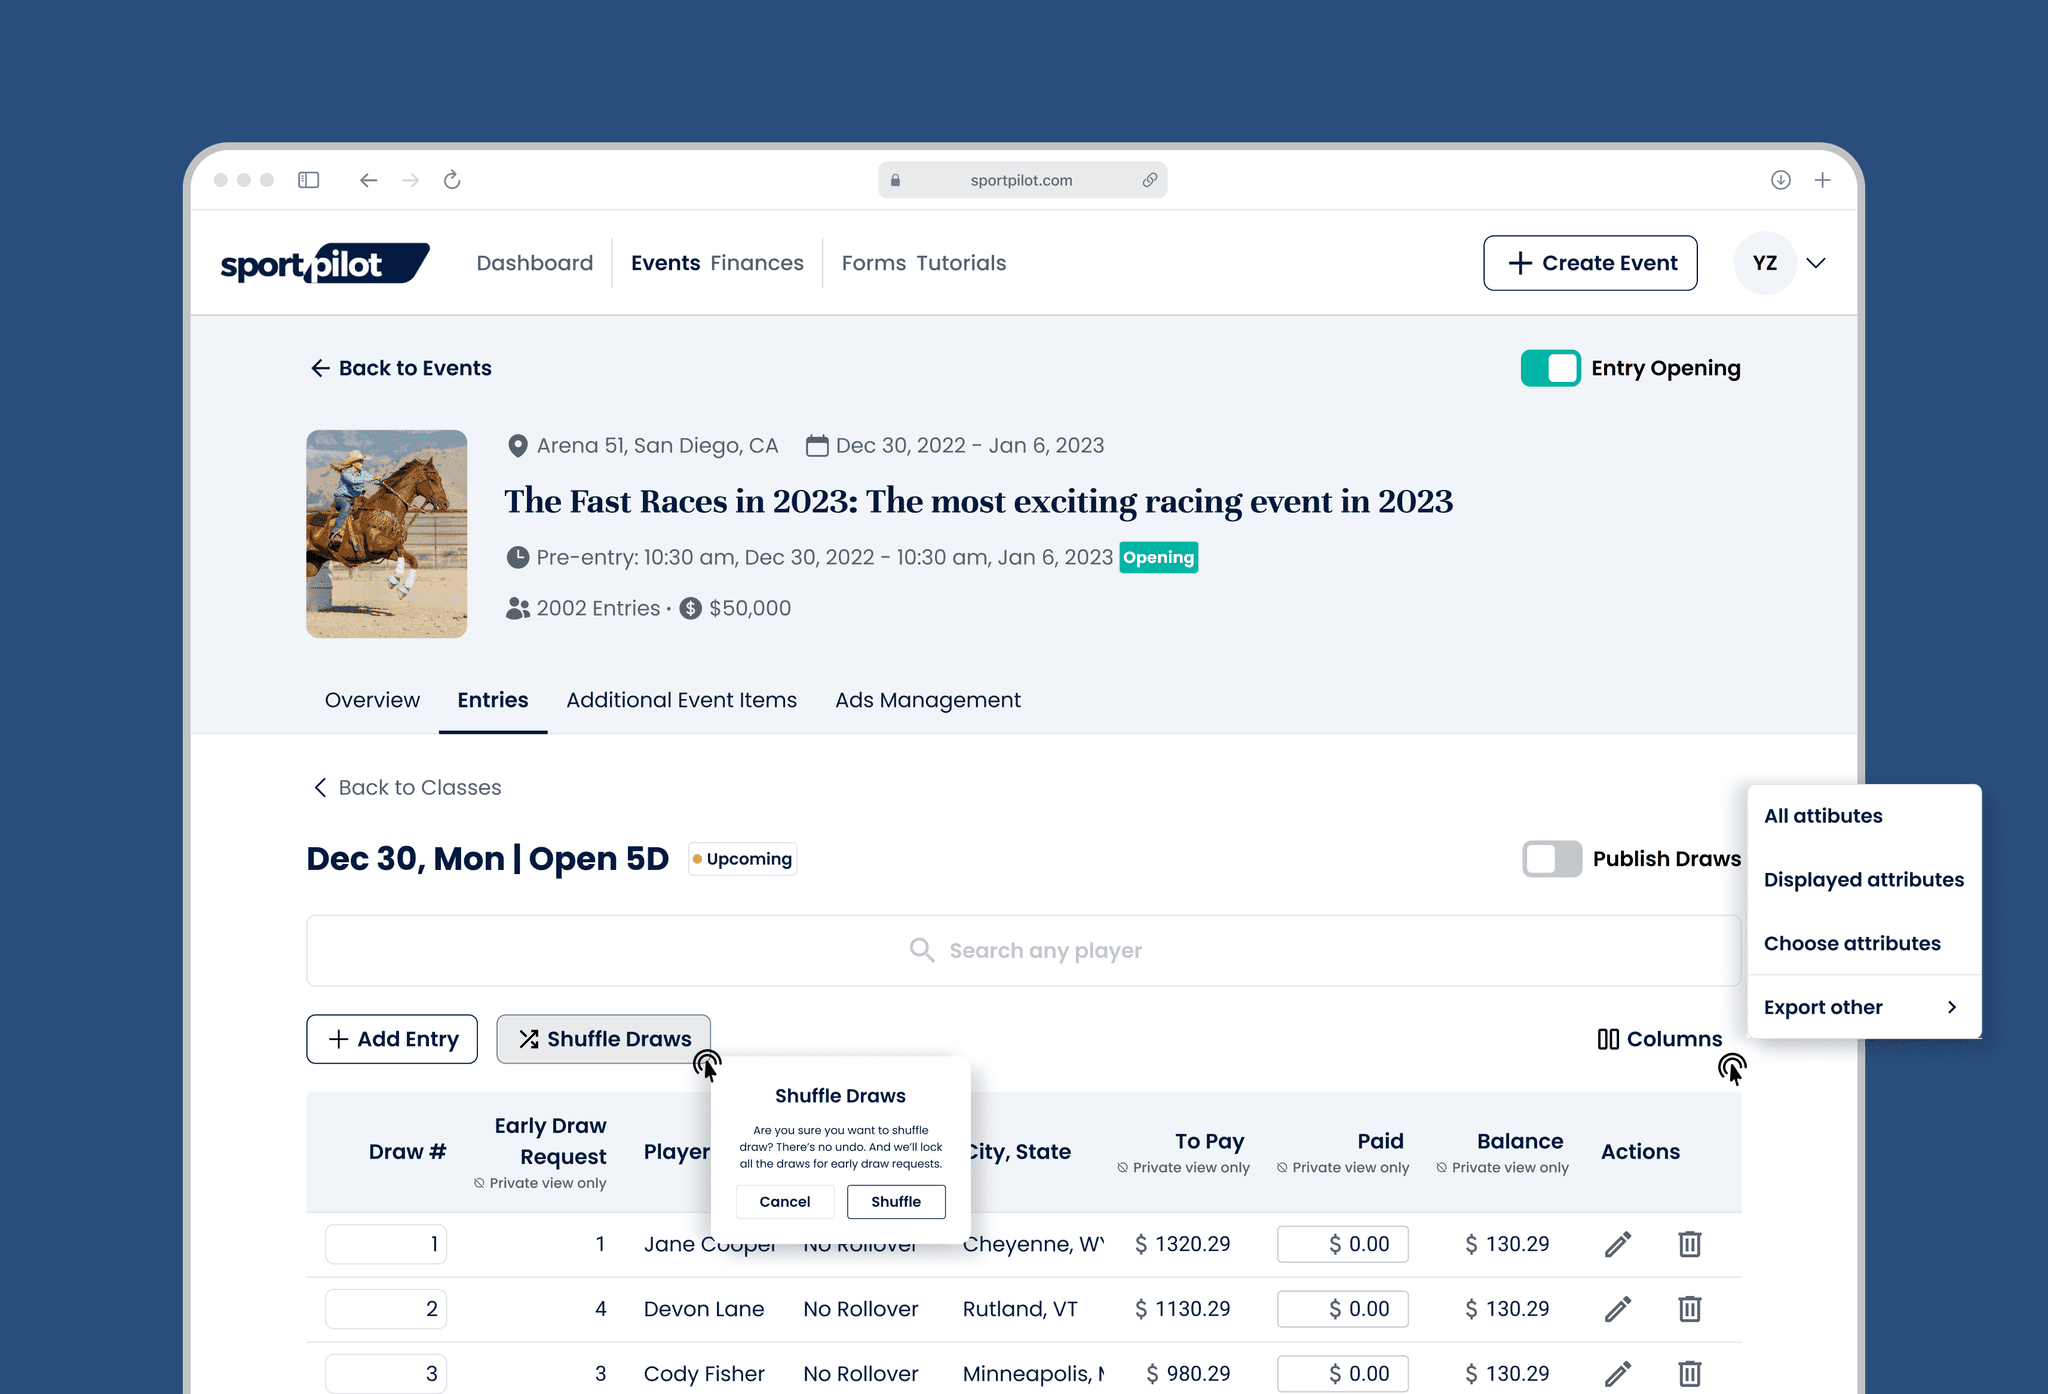
On-site Event Management with fast edits, smooth operations.
Final Solution.
Top-down Management
Tools for real-time edits, entry tracking, and payout coordination—designed to support fast, repeatable operations during live events.
Quick Add Entry
lets producers update participant lists on the fly without interrupting the system logic.


Invoice module
gives producers real-time access to payment statuses and balances, reducing unnecessary rider communication.
(Please contact me for more of my work details, including
designing a mobile app for riders, a marketing website, as well as event creation flow)
Wrap-ups
What did I learn about stakeholder communication, client management, and quick validations?
Reflections.
Incorporate Feedback Early-on
I kept seeking feedback from developers and clients about the design. It prevented a lot of misunderstandings in the design phase and helped better alignment.
Design for Systems
The scope of this project was huge, so it is more important to prioritize what to build first (communicating with engineers and clients closely is key).

Rodeo Sport Mobile App Design
B2C Mobile for Riders
Easy access to event schedules, results, and notifications on the go


Rodeo Sport Marketing Website
Marketing Website
SportPilot's value proposition and drive product sign-ups